Our results, in numbers

These are real screenshots from ad accounts we managed. Campaign and competitor names are hidden out of respect for our clients; the numbers are unedited.

Every agency says it "gets results". The difference is seeing the number. At Wave we judge every campaign with three questions: what did each conversation or lead cost, how much revenue came back for every unit spent, and did the ad reach the right people. The screenshots below come from Meta Ads Manager, Google Ads and an online store dashboard, each with a short note on what the number means.

Results depend on the product, market, budget and offer, so treat these as examples of how we work, not a promise of a specific number.

Lead generation, Meta

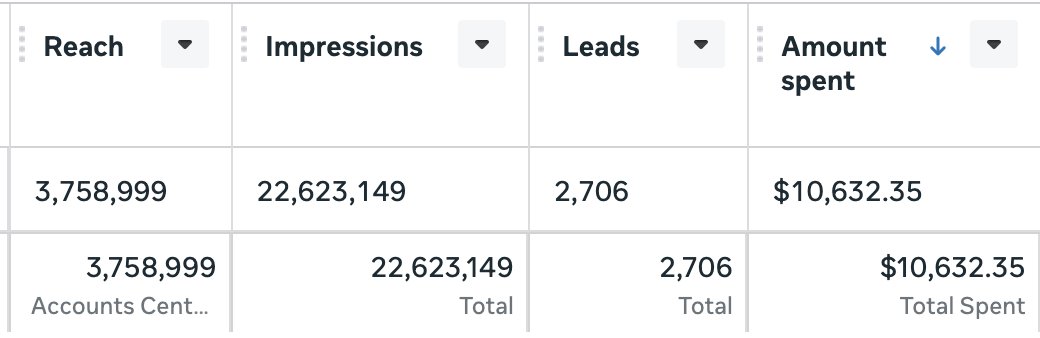
2,706 leads at about $3.9 each

2,706leads
$10,632total spend
3.76Mreach
22.6Mimpressions

A Lead Ads campaign on Facebook and Instagram aimed at people leaving their number for the sales team. Spend divided by leads gives roughly $3.9 per lead.

Paid media →
2,706 leads at about $3.9 each
Online sales, Meta

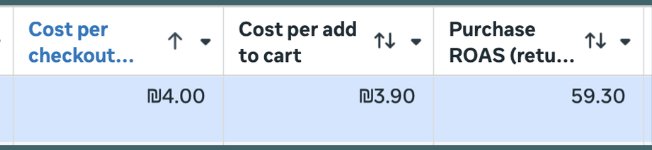
A 59.3x return on ad spend

59.3purchase ROAS
3.90cost per add to cart
4.00cost per checkout

A sales campaign for an online store on Meta, in the account currency (shekel). A ROAS of 59.3 means every unit spent on this campaign returned about 59 units in pixel tracked sales. That is exceptional and not typical of every campaign, but it shows what happens when content, audience and tracking are right together.

Paid media →
A 59.3x return on ad spend
E-commerce

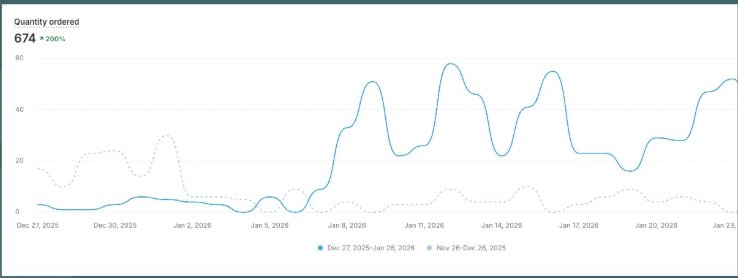
674 items ordered in a month, up 200%

674items ordered
200%+vs previous month

An online store dashboard from 27 December 2025 to 26 January 2026, compared with the month before (dotted line). Orders went from low numbers to repeated daily peaks during the month.

Landing pages and tracking →
674 items ordered in a month, up 200%
Brand awareness, Meta

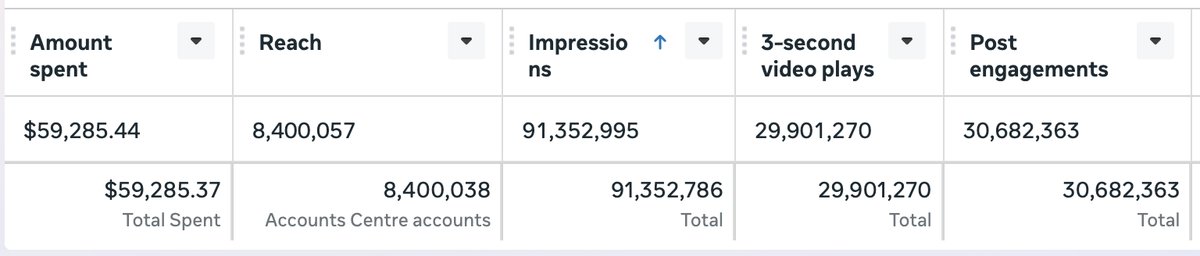
8.4M people and 91M impressions

8.4Mreach
91.35Mimpressions
29.9M3 second video plays
$59,285total spend

A large awareness campaign with a budget of about $59K. In awareness campaigns we don't stop at reach: we watch how many people got through the first three seconds of the video, because that tells us whether the hook works. Here the video was watched for three seconds or more about 29.9 million times.

Paid media →
8.4M people and 91M impressions
Content production, Phobia

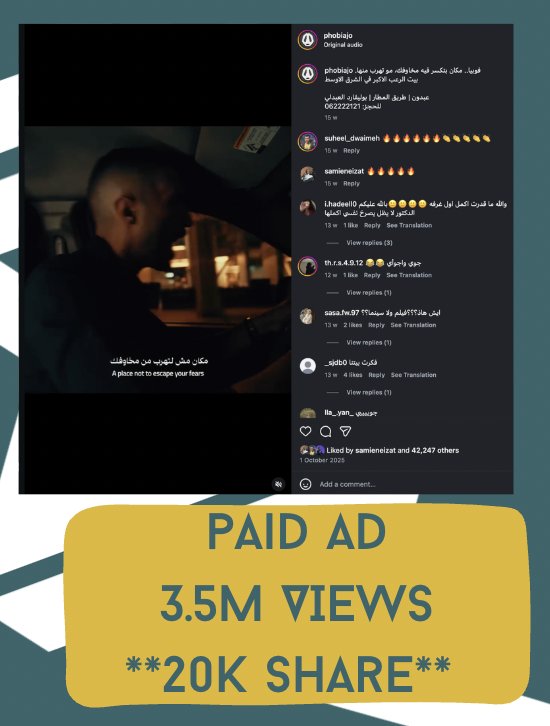
One ad: 3.5M views and 20K shares

3.5Mviews
20Kshares
42Klikes

A paid ad for Phobia, a horror house in Amman, written and filmed by us in a cinematic style. Shares are the strongest sign that people liked the content enough to send it to someone else, and 20K shares on a paid ad is rare.

Content production →
One ad: 3.5M views and 20K shares

How we read these numbers

  • Cost per conversation and per lead: what you paid for each WhatsApp message or each person who left their number. This is the number your sales team cares about.
  • ROAS: tracked revenue divided by ad spend. It needs correct tracking to be honest.
  • Views and shares: a measure of content strength, not a goal on its own. We use it to decide which hook and idea to scale.

Want us to apply this to your brand?

Message us on WhatsApp, tell us what you sell and to whom, and we'll come back with a first idea and a plan.

Chat with us on WhatsApp